
Dashing Data Viz - Issue 234
Curated news, articles and jobs related to Data Visualization.
Issue #234
April 18 2023
Hello and Happy Tuesday! :)

This is Sebastian, curator of the Dashing Data Viz newsletter.
Once a week I write this email to share the links I thought were worth sharing.
If this useful to your work, please consider becoming paid subscriber here:
https://dashingdataviz.substack.com/subscribe .
If you don’t find this useful, unsubscribe here.
:)
Before we dive into this week’s links, some editor notes:
Editor Notes:
Thanks for filling out the poll last week!
The poll was on what you would like help with. The results look like this:
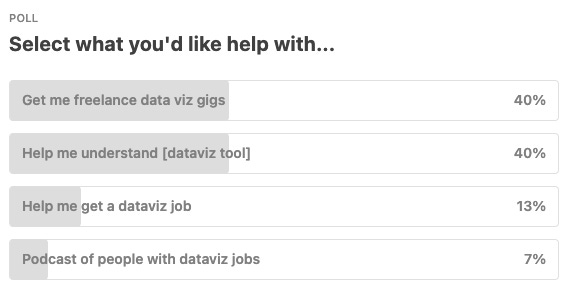
For freelance data viz gigs:
There are many resources of a) how to build a portfolio, b) how to think about pricing, c) how schedule your time, d) how to work with clients, e) … etc.
There’s also a few data-viz-related slacks/discords where people post jobs and opportunities that you can apply to (though it means you have to be monitoring them all the time).
The sad reality of this is that if you aren’t a “name” it can be hard to find work without spending the time and energy to have people find you.
On the other side, you can scour places like Upwork (or similar) to see if there are people who are looking for your skill set, but then they want you to do 2 months of work for $100 dollars (and they’ll be unpleasant to work with because their demands are so ludicrous).
In the middle are services I’ve seen work in the web design field where:
You subscribe to a lead-generation email list and if you book a client, you a pay a fee
You join a managed marketplace where someone is the “face” of the design consulting shop (who charges a percentage of the fee) and you do the backend design work with the agreement that once it’s done you can add it to your portfolio as your own.
I have yet to see either of these models in the data viz space, so it’s worth thinking about.
If you have any thoughts or are interested in exploring this further hit reply and let me know (or post in the comments section)
For help understanding data viz tools:
I originally started this email (about 10 years ago) to help people with D3.js (and some of you are from that time - thank you!). The space matured and fractured and is now facing GPT4/AI tools, so I’d be interested in hearing more about what data viz tools you’d like to learn.
I’ve done 8+ hour long video courses, 4-5 day in-person corporate training, screencasts, e-books, youtube videos, webinars, meetups, conference talks, etc so I’m happy to help here and have a system that works, but without knowing what you want to learn, it can take time to get there.
If you have any thoughts or are interested in exploring this further hit reply and let me know (or post in the comments section).
Thanks for reading this or if you skipped down to here, i’m done :)
And now, let's dive into this week’s links:
Data Visualization Articles & Videos
I find Voronoi treemaps really appealing
I find Voronoi treemaps really appealing, bc of their special look and feel, which (I guess) makes this kind of #dataviz somehow attractive. I even made a JS/D3.js plugin…This thread is a collection of tweets with #voronoiTreemap…
The landscape of biomedical research
We present a 2D atlas of the entire corpus of biomedical literature, and argue that it provides a unique and useful overview of the life sciences research. We base our atlas on the abstract texts of 21 million English articles from the PubMed database. To embed the abstracts into 2D, we use a large language model PubMedBERT, combined with t-SNE tailored to handle samples of our size…Furthermore, we present an interactive web version of our atlas that allows easy exploration and will enable further insights and facilitate future research…Simple, responsive layout template for web mapping projects
I made a bare bones responsive web map layout to help my students (and anyone really) get started quickly and focus on the rest of the experience instead of futzing with CSS and media queries…Alignment of Spatial Transcriptomics Data with STalign
In this blog post, I will try to summarize the gist of our latest bioRxiv preprint “Alignment of spatial transcriptomics data using diffeomorphic metric mapping” in a way that is hopefully more accessible to the newer and more junior members of my lab. We will also walk through a use case of the associated tool, STalign, to take a more hands-on approach to understanding the underlying computational methodology…
Our advice to data viz designers just starting out
I’ve been recording my podcast for almost two years, and I ask every guest, “What’s your advice to data viz designers just starting out?” I decided to gather up all that advice and share it here for anyone looking for advice from the pros. Here we go!..Create a 'click to order' stacked histogram in Vega-Lite
🤯 everytime I think I've seen all of the uses of #vegalite params, I stumble across new ways of making interactive visualizations with them. Here, we create a 'click to order' stacked histogram– allowing you to compare categories on a common baseline #visualization…How to wrap long axis tick labels into multiple lines in ggplot2
In this tutorial, we will learn how to wrap really long axis tick labels into multiple lines in R while making plots with ggplot2. A long axis text labels make harder to understand the plot and ofter it overlaps with the neighboring labels and obscuring the labels. Here we will see two different ways to wrap long axis labels into multiple ways. First, we will use stringr’s str_wrap() function and then use scales’s label_wrap() function to wrap the labels by specifying a width…The history of rules about women's clothing worldwide
I created a Data Visualisation about the history of rules about women's clothing worldwide, I visualised this in 2 different ways and couldn't decide which one was my favourite. Let me know which version you like more? art by me…
Quantifying species range and overlap with fire-burned areas using concave hulls
Calculating range overlap is an efficient way to estimate the impact of natural disasters on biodiversity. Here we’ll use curated datasets to compute concave hulls to visualise the spatial distribution of Apidae (Bees) and Daviesia (Bitterpeas) and their overlap with burned areas of the Black Summer fires of 2019-2020…
Title-only links:
Last Week's Newsletter's 3 Most Clicked Links
* Based on unique clicks.
** Find last week's issue #233 here.
Have an awesome week!
All my best,
Sebastian Gutierrez
P.S., Enjoyed reading this? Hit ❤️ button below and don’t forget to vote in the poll!
Copyright © 2013-2023 Dashing Data Viz (formerly DashingD3js.com), All rights reserved.
Hi Friends!
Starting a chat so you're not the first one ;)